


Example for Run-Time Evaluation
The results obtained with the run-time data evaluation system will be briefly illustrated in this section. During the experiment pressure measurements are taken at four sections of the wing. The wing sections are numbered 1 to 4, number 1 being the closest to the aircraft body. Figure 5 illustrates their positions.
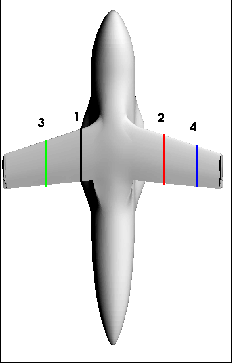
Figure 5 Position of pressure measurements at four sections of the clipped wing. Due to the limited space in the wings, the sections used for the pressure measurements are distributed over both wings.
A simple visualization tool allows to display pressure profiles for comparison. Figure 6 shows these plots for a given free stream flow and angle of attack. The plot gives a first estimate of the shock location.
Obviously it would be very time consuming and unaccurate to extract the shock position "manually" from such visualization for a large number of measurments.
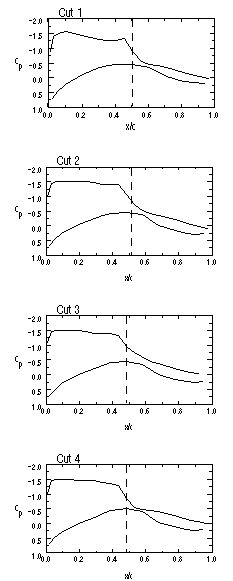
Figure 6 Pressure profiles at 4 wing sections for Mach number 0.74 and angle of attack 4.50 . The angle of the CCSB on the upper side of the wing is 150, on the lower side 100.
However, it is important that such visualization of the basic data is available at any time in case of there are doubts about the data acquisition or the following evaluation steps. These plots turned out to be of particular use for error detection.
One of the selection criteria for defining a set of flow parameters allowing for valid aerodynamic testing with corrected scale and wing clip influence was the position of the shock on the upper surface of the wing. For the design point of the CCSBs the shock should be parallel to the trailing edge of the wing.
The software provides extraction of the shock position by analysis of the steepest gradient in the pressure distribution after interpoling the pressure profile. This is performed for all measured cross sections of the wing.
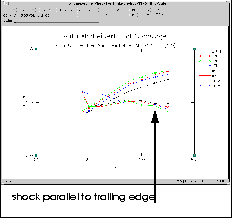
Figure 7 Visualization of lift coefficient and shock location for four wing sections. Flow parameters are equivalent to Figure 6.
Figure 7 shows a comparative visualization of the shock position xs versus chord length c of four different cross sections plotted against angle of attack a. When the CCSBs fit optimal to the flow conditions, three of the shock positions coincide, indicating a shock at x/l=const. or in general, a flow on top of the wing equivalent to an unclipped wing. The inner wing section (xs1) is not expected to follow this trend exactly because of the significantly different cross section.
Extracting the shock position for a series of tests with varying angle of attack, as shown here, allows to detect trends in the motion of the shock wave. This may be used for an optimized procedure to adjust the design angle of attack for a given set of CCSBs.
For additional information the lift curves are plotted in the same window. This is important to check for flow separation or buffeting conditions.
Such evaluation quickly proves the feasibility of the experimental approach. In the meantime a series of tests have been conducted successfully using the F9 model and the software described above. Further evaluation of these tests will be the subject of future publications 10.