1 Aircraft design
An on-going project for the design of a high wing transport aircraft [1] attempts the integration of aircraft geometry design tools, CFD grid generation, CAD model design, windtunnel model machining, CFD analysis, windtunnel testing and data analysis and visualization. One of the goals of the project is a higher degree of similarity between CFD and flow experiments creating all necessary geometry data from a common design thus trying to minimize the loss of details and the sources of error in various conversion processes. Comparative visualization is one of the key techniques for this integration process.
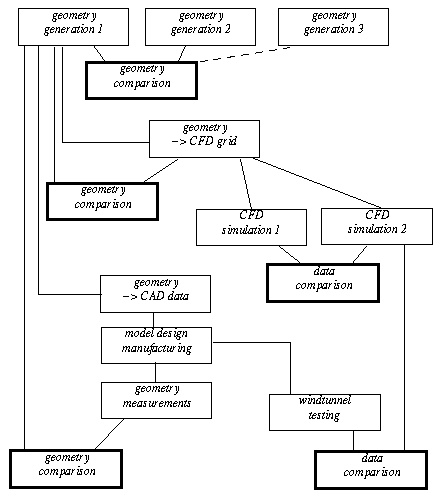
The aircraft design process starts off by the design of the aerodynamic shape of the aircraft body and wing as well as other components of the aircraft. For the aerodynamic design special geometry generation techniques are in use [2]. Today these algorithms exist in various design tools allowing to tailor the geometry towards the particular requirements of CFD analysis codes (Fig. 1). In the example given below (Fig. 3 and Fig. 5) different algorithms to deal with geometry curvature and smoothness are compared in order to find the optimum input data for a CFD code.
After a decision has been taken for the geometry generation algorithm the geometry data will be transferred into a system for CFD grid generation. What system to use depends on the CFD code selected for the flow analysis. One of the codes in use, the DLR-t-Code, requires the use of unstructured grids. Comparative visualization is used to verify the consistency of the geometry data after conversion to unstructured grid data.
Fig. 1
 Comparative visualization in various steps of the aircraft design process
The geometry data from the geometry generation step mentioned above was also imported into the CAD system CATIA. Details of the windtunnel model, such as screws, instrumentation, supporting parts were added manually by a designer without changing those parts of the shape which have aerodynamic significance. The model was then manufactured using numerically controlled machine tools. After manufacturing is finished the final shape of the model will be measured using automated data acquisition. Comparative visualization will be used to verify the geometry of the windtunnel model against the design data.
Presently the first preliminary CFD results were obtained for the high wing transport aircraft. Comparative visualization is used to compare flow simulations with shape variations or with varying flow parameter against each other. The ultimate goal is to numerically simulate the flow around the windtunnel model at windtunnel conditions and directly compare those simulations to the experimental data, once the windtunnel testing takes place.


